Assignment Prompt
Calorimetry and Heat Capacity of a Metal
Purpose
The purpose of this lab is to
(1) determine the relationship between mass, change in temperature, and heat using the concepts of calorimetry, and
(2) determine the heat capacity of aluminum.
Introduction
The first law of Thermodynamics states that the energy in the universe is constant. Therefore, when a hot piece of metal is added to a cup of water, the energy in the metal, the energy in the water, and the energy of the surroundings is constant. Since q is the amount of heat energy gained or lost at constant pressure, the exchange of heat energy between the heated metal and the water can be summarized as:
q_metal+ q_water+ q_(surroundings )=0
In a laboratory setting, a coffee cup calorimeter can be constructed using two Styrofoam cups, one inside another to insulate the system so that the heat lost to the surroundings is small. If the assumption is made that the heat gained or lost is negligible, then
q_surroundings=0
This isn’t an accurate assumption, but makes the system simpler to understand and work with in a laboratory setting. The previous equation would therefore simplify to:
q_metal+ q_water= 0
This can further be rearranged to:
q_water= -q_metal
A positive q value denotes an increase in heat (heat gained), whereas a negative q value denotes a decrease in heat (heat lost).
In order to make the amount of heat lost to the surroundings small, it is important that the cover be kept on the calorimeter as much as possible. When the cover has to be removed to put the metal into the water, do so as quickly as possible.
Pre-lab questions:
In the calorimeter which component do you think is losing heat (metal or water)? Explain how you made that decision and cite your sources!
When heat is lost, what do you expect the sign on heat to be? Why?
In the calorimeter which component do you think is gaining heat (metal or water)? Explain how you made that decision and cite your sources!
When heat is gained, what do you expect the sign on heat to be? Why?
Procedure:
Obtain as cylinder of aluminum that is about 2 cm x 1.25 cm diameter. Weigh the cylinder and enter the weight in the blank provided for “Mass aluminum cylinder “ above Data Table 1.
Place a 250 mL beaker with about 150 mL of water in it on a hot plate and turn the heat up to 10 on the knob.
Place the aluminum cylinder in the hot water bath and allow it to boil for at least 5 minutes while you prepare the rest of the experiment.
Ensure that the aluminum cylinder is completely covered while being heated to ensure proper heat transfer!
Assemble your coffee cup calorimeter using the figure provided. Weigh the two styrofoam cups and enter the mass of the calorimeter in the Data section in the blank provided.
Add 40.000 mL of water to the calorimeter and weigh the calorimeter and the water together. Add or remove water with a plastic pipet until you have as close to 40.000g of water in the calorimeter as possible. Don’t forget to deduct the mass of the two cups!
Place the calorimeter on a magnetic stir plate with a small magnetic stir bar in the bottom of the calorimeter. DO NOT TURN THE HEAT ON – ONLY TURN ON THE MAGNETIC STIRRER. Cover the calorimeter with the cover and allow the water to stir while setting up the remainder of the experiment.
Prepare a data table in your lab notebook with columns for time (s) and for temperature (˚C). Use the data to graph your results and obtain a heating curve.
You should have a graph depicting temperature on the y-axis and time on the x-axis.
Place the thermometer inside the boiling water bath containing the aluminum cylinder to obtain the temperature of the hot water bath.
Once the temperature has reached a plateau (close to 100°C since the water should be boiling), record the temperature in the data section blank provided above Data Table 1 and let the thermometer cool down using some room temperature water.
Once cooled, place the thermometer in the top of the calorimeter as shown in Figure 1. Make sure that the thermometer does not poke a hole into the top cup, and that it is not touching the bottom of the cup.
Begin to write down the temperature in your Time vs. Temp. data table. Collect the initial temperature data (inside the calorimeter) for 15 to 20 seconds.
The temperature during this time should be steady without too many fluctuations. If the temperature fluctuates too much, record data for longer than 20 seconds until it steadies.
Using tongs carefully but quickly transfer the aluminum cylinder to the calorimeter and cover the calorimeter. You must make the transfer quickly so that very little of the heat is lost from the aluminum during the transfer and so that almost all of the heat is transferred to the water.
When the temperature of the water has stabilized for about 10 seconds, stop recording data.
Enter this value in Data Table 1 under the Tfinal column.
Write down the temperature before introduction of the aluminum cylinder and enter this value in the Tinitial column of Data Table 1. Calculate the change in temperature, ∆T.
Dispose of the water in the calorimeter but DO NOT lose the stir bar. Place the aluminum cylinder back in the boiling water bath to re-heat.
Repeat this experiment with two additional (different at least by 5 g) masses of water for a total of three different trials (T1-T3).
Assume that the weight of the calorimeter as entered in Data Table 1 is constant for all of these experiments.
Pick one mass of water and perform two additional trials of the same mass. Place this data (and copy the original data point) in Data Table 2 (R1-R3).
NOTE: If at any time the boiling water bath heating the aluminum cylinder evaporates to the point that the aluminum bar is exposed, you need to add more water back into the beaker; however, you must wait until the water reaches boiling again before continuing with the experiment!!
Data
Mass aluminum cylinder:
Mass Calorimeter: _______________
Temperature boiling water bath:
Data Table 1
Trial # m Cal + water (g) m water (g) Tfinal water (°C) Tinitial water (°C) ∆T(°C)
T 1
T 2
T 3
Data Table 2
Trial m Cal + water (g) m water (g) Tfinal water (°C) Tinitial water (°C) ΔT (°C)
R1 (from Data Table 1)
R2
R3
Average
Calculations
Water is known to absorb heat energy according to the following equation, where q is the amount of heat energy gained or lost by the water.
q=m c ΔT
where q is the amount of heat energy gained (or lost) by the water
The mass of the water is symbolized by m
∆T is the change in temperature, or the temperature gained or lost. It can be calculated as follows
∆T = final temperature – initial temperature.
The temperature change can be positive or negative depending on whether the temperature increases or decreases.
The specific heat capacity of water is c and the value of c = 4.184 J/g°C for water.
Given this equation, it is possible to use the mass of water and its corresponding temperature change to calculate the amount of heat energy gained or lost by the water.
Calculate the heat gained by the water in each of the three experiments in part 1 and part 2 of this lab and enter the data in Data Tables 3 and 4.
Show a sample calculation in the space in your lab report using the values for T1 from Data table 1.
mwater = mass of water =
cwater = specific heat of water =
∆T(°C) =
qwater = mwater cwater ∆Twater
Substituting the values q
qwater =
If water is absorbing the heat, then the metal is losing the heat. According the law of conservation of energy, “Energy can neither be created nor destroyed”. So, if the water is absorbing the energy, something else is losing the same amount of energy.
The only other source of energy is the hot metal. So whatever heat is absorbed by the water comes from the heated metal. We can say the amount of heat absorbed by the water is equal to the amount of heat lost by the metal.
- qmetal = qwater
The negative sign in front of the qmetal indicates that the metal is losing the same amount of heat which the water is gaining. Enter the amount of heat lost by the metal in data tables 3 and 4.
Calculate the heat gained by the water in each of the three experiments in Part 1 of this lab and enter the data in Data Table 3. Based on this, determine the heat lost by the aluminum bar, and then calculate an experimental value for the specific heat of aluminum using the equation above.
Data Table 3
Trial # m water (g) c water (J/g °C)) ∆Twater(°C) qwater in J
qmetal in J
T 1
T 2
T 3
Average of three trials
Data Table 4
Trial m water (g) c water (J/g °C)) ∆Twater (°C) qwater in J
qmetal in J
R1 (from Data Table 1)
R2
R3
Now, since we know the amount of heat lost by the metal, the mass of the metal and the temperature change, we can say:
qmetal; =
mmetal; =
Tfinal for the metal; =
Tinitiall for the metal; =
∆Tmetal =
So now we know
qmetal; = mmetal cmetal ∆Tmetal
We can substitute and solve for cmetal
Data Table 5
Trial # mmetal (g) qmetal in J ∆Tmetal(°C) c metal (do not forget the units)
T 1
T 2
T 3
Average cmetal =
Data Table 6
Trial # mmetal (g) qmetal in J ∆Tmetal(°C) c metal (do not forget the units)
R 1
R 2
R 3
Average cmetal =
Look up the value of the specific heat of aluminum. Don’t forget to cite your source.
Calculate the % error based on your average value.
Data Analysis and Post lab questions
The amount of heat contained in the aluminum cylinder, q, is related to the kinetic energy of the aluminum atoms and is proportional to temperature only.
Is the heat energy (q) contained in the aluminum cylinder the same for all experiments performed? Justify your answer.
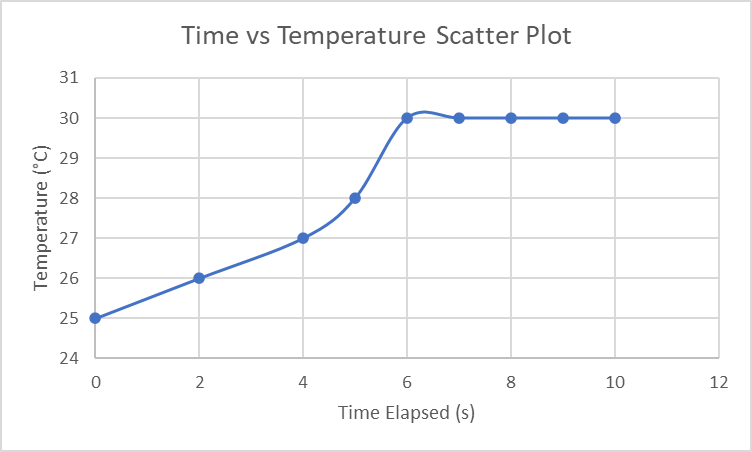
Graph a heating curve for one of your experiments using Microsoft Excel. Use the data from one of your Time versus Temperature data tables, making sure to graph it as a Scatter Plot and label all axes correctly, including proper units. Show where on the graph you found Tinitial and Tfinal.
Discuss the temperature change, ∆T, for experiments T1, T2, and T3. Are they the same or very close to the same value? Should they be the same for these three experiments when the mass of the water was the same? Justify your answer.
Discuss the temperature change, ∆T, for experiments R1, R2, and R3. Are they the same or very close to the same value? Should they be the same for these three experiments when the mass of the water was the same? Justify your answer.
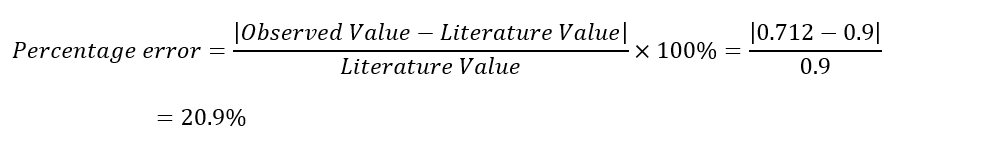
Comment on the average specific heat of the metal you calculated based on the 3 trials with the same mass of water (R1, R2, R3). Look up the value of the specific heat of aluminum. Don’t forget to cite your source. Calculate the % error based on your average value.
Which of the three values of specific heat of the metal you calculated with different masses of water (T1, T2 and T3) are close to the actual value of the specific heat of aluminum? Why do you think this value is the closest to the actual value?
Comment on the average specific heat of the metal you calculated based on the values you calculated in R1, R2 and R3. Calculate the % error based on your average value.
Be sure to attach any data tables, graphs, and analysis of your data in your lab report.
Calorimetry Lab Purpose
Introduction
Energy is a fundamental concept in chemistry since it governs the behavior of matter and its interaction with the system, as illustrated in this report. The first law of thermodynamics states that energy cannot be created nor destroyed but is, on occasion, transformed from one form to another (Chang & Overby, 2011, p. 180). This suggests that the energy gained by one body must come from another regardless of its form. One of the most common forms of energy is heat (q), which is thermal energy, both kinetic and potential, possessed by an object or system as a result of its temperature and moves from a region of high concentration to a lower one (Sullivan & Spencer, 2022). It is calculated by the formula; 1 The Changes in Temperature for Varying Masses of Water
|
Trial # |
m Cal + water (g) |
m water (g) |
Tfinal water (°C) |
Tinitial water (°C) |
∆T(°C) |
|
T 1 |
43.668 |
40.000 |
30 |
25 |
5 |
|
T 2 |
39.312 |
35.643 |
29 |
24 |
5 |
|
T 3 |
33.941 |
30.272 |
29 |
24 |
5 |
Note. Table 1 demonstrates the changes in temperature after adding the aluminum metal to three masses of water, each differing by 5g.
Table 2 The Change in Temperature for Three Trials with Constant Mass of Water
|
Trial |
m Cal + water (g) |
m water (g) |
Tfinal water (°C) |
Tinitial water (°C) |
ΔT (°C) |
|
R1 (from Data Table 1) |
43.668 |
40.000 |
30 |
25 |
5 |
|
R2 |
43.740 |
40.072 |
30 |
26 |
4 |
|
R3 |
44.167 |
40.498 |
29 |
25 |
4 |
|
Average |
|
40.190 |
|
|
4.33 |
Table 2a Time vs. Temperature Table for Trial 1
|
Time (s) |
Temperature (°C) |
|
0 |
25 |
|
2 |
26 |
|
4 |
27 |
|
5 |
28 |
|
6-10 |
30 |
Sample Calculations
Heat Gained or Lost by Water in T1 from Table 1
mwater = mass of water =40.000g
cwater = specific heat of water = 4.187 J/(g.°C)
∆T(°C) =5
qwater = mwater cwater ∆Twater =40.000g×4.184 J/(g.°C)×5°C=836.8J
Substituting the values q
qwater = 836.8J
Heat Lost or Gained by Aluminum in T1 from Table 1
The heat gained by the water is the same as the heat lost by the Aluminum metal
qwater=- qmetal
Since qwater=836.8J, then q metal=-836.8J
Table 3 The Change Heat Gained or Lost by Water and Aluminum with Changing Mass
|
Trial # |
m water (g) |
c water (J/g °C)) |
∆Twater(°C) |
qwater in J
|
qmetal in J
|
|
T 1 |
40.000 |
4.184 |
5 |
836.800 |
-836.800 |
|
T 2 |
35.643 |
4.184 |
5 |
745.652 |
-745.652 |
|
T 3 |
30.272 |
4.184 |
5 |
633.290 |
-633.290 |
|
Average of three trials |
35.305 |
4.184 |
5 |
738.581 |
-738.58 |
Table 4 Change in Heat Lost or Gained with Similar Mass
|
Trial |
m water (g) |
c water (J/g °C)) |
∆Twater (°C) |
qwater in J
|
qmetal in J
|
|
R1 (from Data Table 1) |
40.000 |
4.184 |
5 |
836.800 |
-836.800 |
|
R2 |
40.072 |
4.184 |
4 |
670.645 |
-670.645 |
|
R3 |
40.498 |
4.184 |
4 |
677.775 |
-677.775 |
|
Trial # |
mmetal (g) |
qmetal in J |
∆Tmetal(°C) |
c metal
|
|
T 1 |
16.682 |
-836.800 |
61 |
0.822 J/g °C |
|
T 2 |
16.682 |
-745.652 |
62 |
0.721 J/g °C |
|
T 3 |
16.682 |
-633.290 |
62 |
0.612 J/g °C |
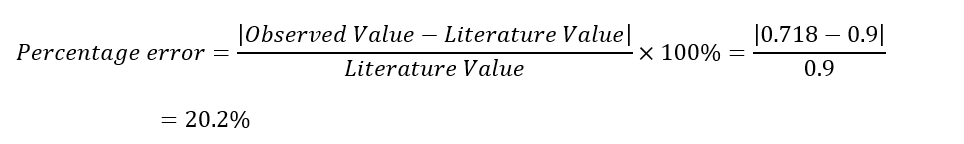
Average cmetal =0.718 J/g °C
|
Trial # |
mmetal (g) |
qmetal in J |
∆Tmetal(°C) |
c metal
|
|
R 1 |
16.682 |
-836.800 |
61 |
0.822 J/g °C |
|
R 2 |
16.682 |
-670.645 |
61 |
0.659 J/g °C |
|
R 3 |
16.682 |
-677.775 |
62 |
0.655 J/g °C |
Average cmetal = 0.712 J/g °C
Data Analysis and Post-Lab Questions
1. Is the heat energy (q) contained in the aluminum cylinder the same for all experiments performed? Justify your answer.
Yes. The heat energy (q) when the Aluminum cylinder is removed from the hot water bath is the same for all experiments because the bath was kept at a constant temperature, which means the same energy was transferred from the water bath to the Aluminum cylinder in all trials.
The temperature was the same, 5°C, but it should have been different. In experiments T1, T2 and T3, the mass of the water was different from each other by about 5g. While the temperature and, therefore, the heat of the aluminum were the same in all experiments, experiments involving more water should have resulted in lower ∆T. This is because more atoms require their kinetic energy to be raised, which means that after sharing the available energy, each will have less than in experiments with fewer water atoms. As such, the temperature rise was expected to be lower.
5. Comment on the average specific heat of the metal you calculated based on the 3 trials with the same mass of water (R1, R2, R3). Look up the value of the specific heat of aluminum. Don’t forget to cite your source. Calculate the % error based on your average value.
Aluminum's average specific heat capacity was determined to be 0.712 J/g °C. This differs slightly from the textbook value of 0.900 J/g °C (Chang & Overby, 2011, p. 191). The obtained value has a percentage error of 20.9%, indicating some errors during the experiment.
T1, which resulted in a specific heat capacity of 0.822 J/g °C. This is the closest value because the other values are even lower than the textbook value of 0.9 J/g °C. It also deviates from the textbook value by 8.67%.
7. Comment on the average specific heat of the metal you calculated based on the values you calculated in T1, T2 and T3. Calculate the % error based on your average value.
Discussion/Conclusion
Thus, the experiment's aim was met since Aluminum's specific heat capacity was determined to be 0.712 J/g.°C. This value, however, was relatively lower than the literature value of 0.900 J/g.°C. This can be attributed to two major sources of error. One potential source of error is inconsistencies in measuring and recording the mass of water, where it is possible that the mass of water exceeded the recorded value, lowering the heat capacity. Alternatively, there could have been errors in taking temperature readings due to a lack of precision. As a result, it is possible that the readings were overestimated, leading to lower values of c.
References
Chang, R., & Overby, J. S. (2011). General Chemistry: The Essential Concepts.
Sullivan, G., & Spencer, M. (2022). Heat and temperature. BJA Education, 22(9), 350–356. https://doi.org/10.1016/j.bjae.2022.06.002
Paper Successfully Completed
This sample paper has been professionally written and meets all academic standards.